

FYIAS (For Your Impatient Attention Span)... scroll down to the end.
Everyone else, enjoy:
Every robotics founder I’ve met ends up shocked by how little they still own by the time they reach Series B.
Not because they were careless, but because the math quietly worked against them.
If you don’t understand how SAFE notes and cap tables interact, you’ll lose ownership one round at a time without noticing…
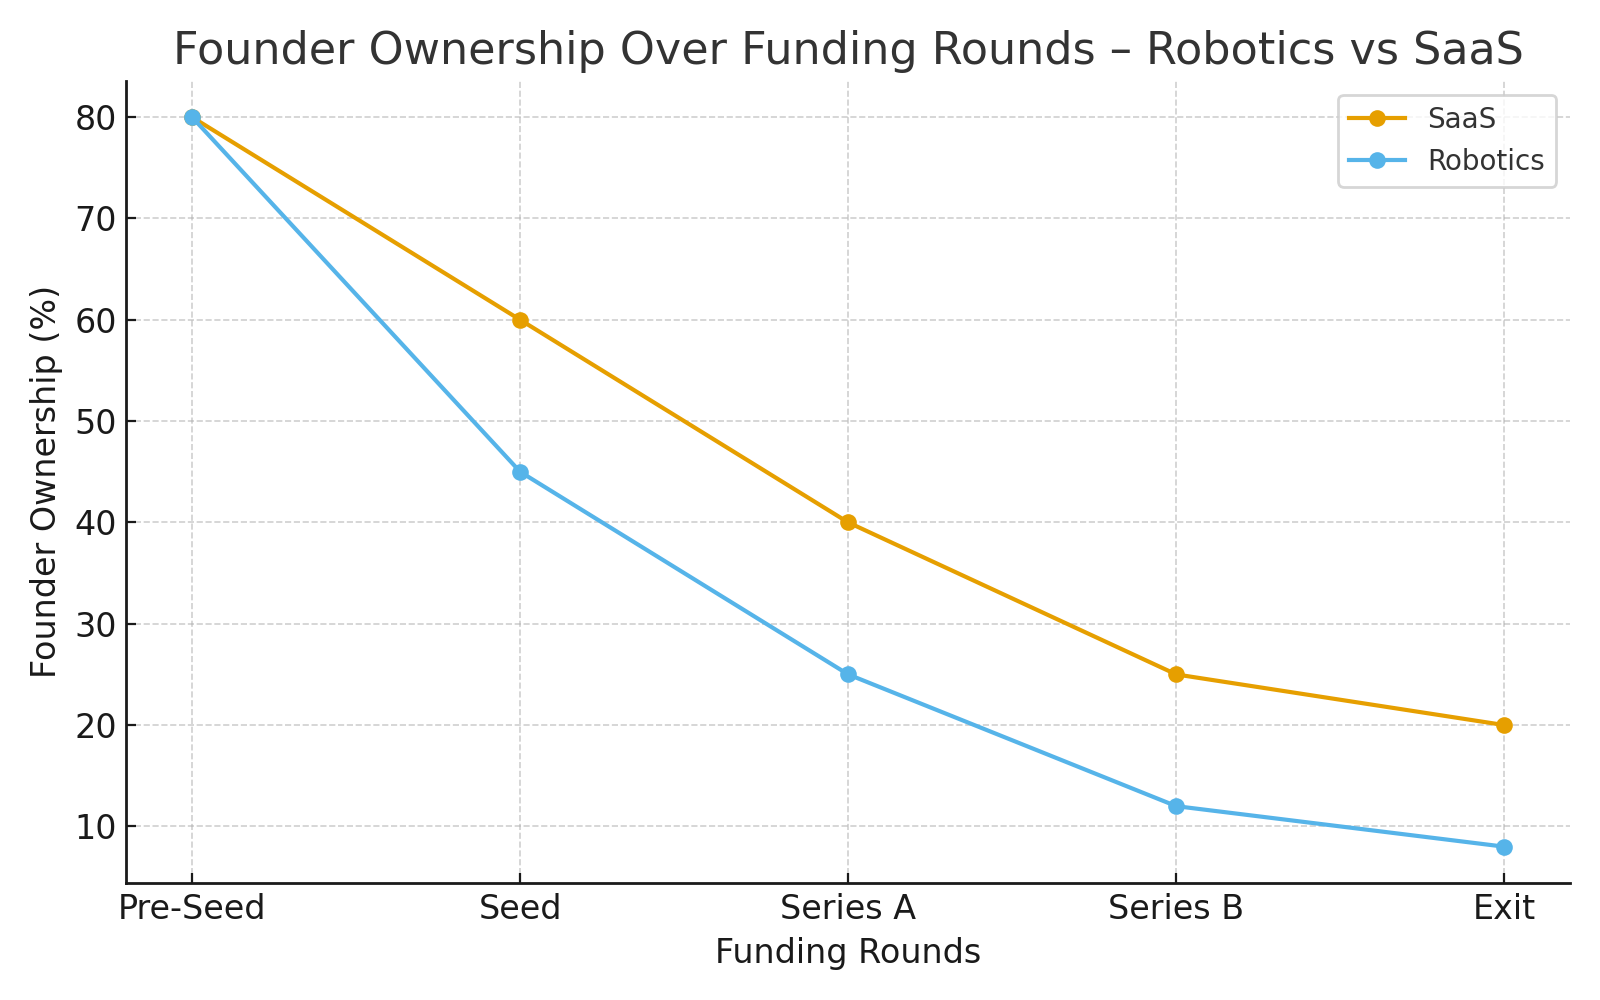
Around 2015, software startups and hardware startups looked remarkably similar at founding. Two technical founders, $100K in the bank, massive ambition. By 2025, the divergence is brutal.
The software founders who started their SaaS company in 2015 raised seed, Series A, Series B, and exited. They owned 20% at exit. The hardware founders who started their robotics company that same year raised pre-seed, seed, seed extension, bridge round, Series A, Series A extension, bridge round, Series B. They owned 8% at exit.
The same $100M acquisition. The software founders made $20M. The robotics founders made $8M.
This isn’t about working harder or building better products. It’s about understanding the specific mechanics of how SAFE notes convert, how cap tables compound dilution, and which mistakes cost you 10-20% ownership by Series B.
The Capital Intensity Problem
Hardware development doesn’t burn cash 20% faster than software. The actual number is 3-5x faster at every stage.
A software startup building a SaaS platform might spend $100K-500K developing their MVP, another $300K-800K reaching product-market fit, then $1-3M getting to Series A traction. Total capital consumed: roughly $1.5-4M over 18-24 months.
A robotics startup faces completely different economics. Prototype development alone costs $500K-3M over 12-24 months. You’re developing custom actuators ($5-20M for novel designs like 1X Technologies’ Revo1 motors), building compute infrastructure for AI training ($50-200M for competitive scale), obtaining safety certifications ($1-5M per platform), and setting up manufacturing capabilities.
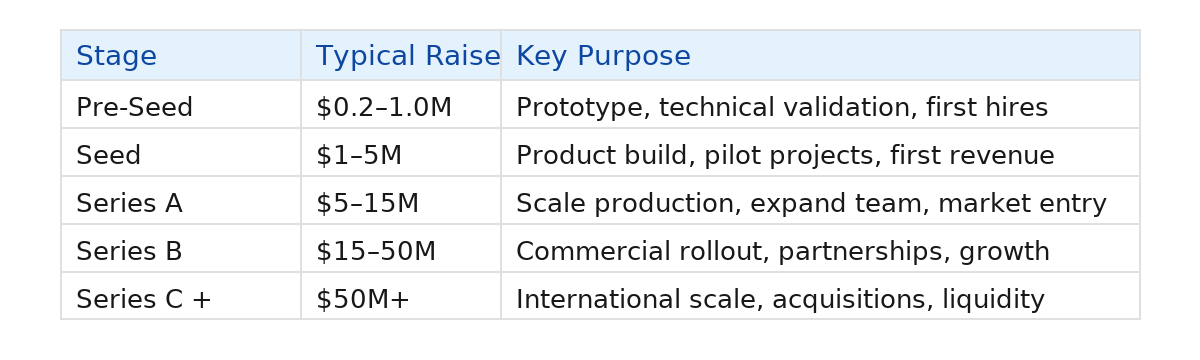
Capital Requirements by Stage:
This capital intensity creates a cascade of consequences. You need more funding rounds because each dollar of progress costs more. More rounds mean more dilution events. Each dilution event compounds with previous ones in ways that aren’t intuitive.
If you experience 20% dilution at seed, then 20% at Series A, you don’t own 60% of your company. You own 64%. The math is multiplicative: 80% × 80% = 64%.
But it gets worse with option pool creation, which happens at pre-money valuation. If Series A investors demand a 10% option pool refresh, that gets created before their investment. You start at 80% post-seed. The 10% pool dilutes you by roughly 11%, bringing you to 72%. Then Series A dilutes you by 20%, bringing you to 57.6%.
Software founders go through this maybe three times. Robotics founders go through it five to eight times. By Series B, you commonly own 30-40% versus 45-60% for software founders.
A founder I spoke with in California (please don’t listen to this, my fellow Europeans) raised three small SAFEs over 18 months: $500K at $6M, then $8M, then $10M caps.
He thought he’d given up about 25%. When the Series A priced, those notes converted below the new round price, and his true dilution hit 45%.
He went from majority owner to minority in one spreadsheet update.
How SAFE Conversion Actually Works
SAFE notes dominate early-stage funding, with 85-89% of pre-seed rounds using them in 2025. They close in under a month versus three months for priced equity, saving $45K in legal fees.
But SAFEs hide complex conversion mechanics that destroy cap tables if you don’t understand them.
Post-Money Versus Pre-Money: The 5-10% Mistake
Post-money SAFEs are now standard (85% of all SAFEs). With post-money, you know your exact dilution immediately. Raise $250K at a $5M post-money cap? That investor gets exactly 5%. Simple math: $250K / $5M = 5%.
Pre-money SAFEs leave ownership unknowable until conversion. Multiple pre-money SAFEs dilute each other in ways founders often miscalculate by 5-10 percentage points. At a $200M exit, that’s $10-20M in lost proceeds.
Valuation Caps: Your Primary Weapon
For robotics companies in 2025:
Pre-seed (under $250K): $6.5-7.5M caps
Pre-seed (over $1M): $12M+ caps
Seed ($250K-$1M): $10M median cap
The cap sets the maximum valuation at which your SAFE converts. Lower cap means investors get more shares.
If you set a $4M cap and raise Series A at $40M pre-money, SAFE holders convert at $4/share while Series A investors pay $40/share. Early investors get 10x more shares per dollar.
The negotiation impact is enormous. You’re raising $500K on a SAFE. An investor proposes an $8M cap. When Series A prices at $40M, your SAFE converts at $8M, giving the investor 6.25% of your company.
But if you had negotiated the cap to $10M, same $500K investment converts to exactly 5%. You just preserved 1.25% of your company through a single conversation. At a $200M exit, that 1.25% is worth $2.5M.
Most first-time founders accept the investor’s initial proposal, leaving millions on the table. Always counter initial cap offers 30-50% higher with comparable data from recent robotics raises.
One founder in the US pushed back on an $8M cap and secured $12M instead.
It felt like a small win at the time, but that single negotiation saved roughly 2% ownership, worth $4 million at exit.
The cap you negotiate today decides your payout a decade from now.
Figure AI’s trajectory shows the premium robotics can command: from $350M valuation in July 2023 to $2.6B in February 2024 to $39.5B by September 2025. That’s 112x in 24 months.
The Conversion Sequence That Changes Everything
Understanding exactly how SAFEs convert determines whether you own 55% or 40% of your company at Series A.
The complete example:
You start with 1M shares (founders and early employees). You raise $500K on a SAFE with $4M cap and 20% discount. You think “this is probably 5-10% dilution.”
Eighteen months pass. You raise Series A: $10M at $40M pre-money, issuing 1M new shares at $10/share.
The SAFE converts at either cap price or discount price, whichever gives investors more shares.
Cap price: $4M cap / 1M shares = $4/share
Discount price: $10 × 0.8 = $8/share
SAFE converts at $4/share (better for investors)
SAFE holder gets: $500K / $4 = 125,000 shares
After all conversions:
Original shareholders: 1M shares (44.6%)
SAFE holder: 125,000 shares (5.6%)
Series A investors: 1M shares (44.6%)
Option pool: ~115,000 shares (5.1%)
You thought you’d own about 50%. You actually own 44.6%. That’s 5.4 percentage points of unexpected dilution, worth over $10M at a $200M exit.
The Dilution Cascade With Multiple SAFEs
This is where founders get destroyed. Imagine you raised three SAFEs over 18 months:
$500K at $4M cap
$500K at $6M cap
$1M at $8M cap
Total raised: $2M. You’re thinking “15-20% dilution total.”
Your Series A prices at $40M. All three SAFEs convert simultaneously:
$4M cap investors got 10x more shares per dollar than Series A
$6M cap investors got 6.7x more shares per dollar
$8M cap investors got 5x more shares per dollar
This is called “high resolution financing” and investors hate it. It signals continuous fundraising rather than efficient execution. It creates complex conversion math. Early investors got much better terms than later investors.
Better strategy: Set a single cap, decide your target raise amount, and close the round when you hit that target in 2-4 months. If you need more capital later, raise Series A earlier or do a proper seed extension at a meaningfully higher cap.
Valuation Benchmarks by Stage
Robotics companies command premium valuations relative to traditional hardware but face higher scrutiny than pure AI plays.
Pre-seed: $5-8M post-money for rounds under $1M. First-time founders: $3-10M pre-revenue. Repeat founders: $15-20M+ based on track record. Hardware/robotics ranks third-highest cap sector behind only crypto and biotech.
Seed: $8-20M post-money, with $10-14M as the sweet spot. Companies raising exactly $2M show highest success rate reaching Series A. Expect 20-30% dilution per seed round.
Series A: $30-80M post-money with wide variance. Median hit $45M in Q3 2024. Deep tech commands 15-25% premium over pure software due to IP defensibility. Revenue multiples range 3-10x ARR for traditional robotics, but AI-first platforms achieve 25-30x multiples. Time to reach Series A stretched to 2+ years from seed (up from 1.7 years in 2019).
Series B: $100-300M post-money, median around $150M. AI-first robotics platforms command dramatically higher valuations. Physical Intelligence raised $400M at $2.4B pre-revenue. Figure AI hit $2.6B at Series B. Traditional robotics with hardware revenues see 2.5x EV/Revenue multiples.
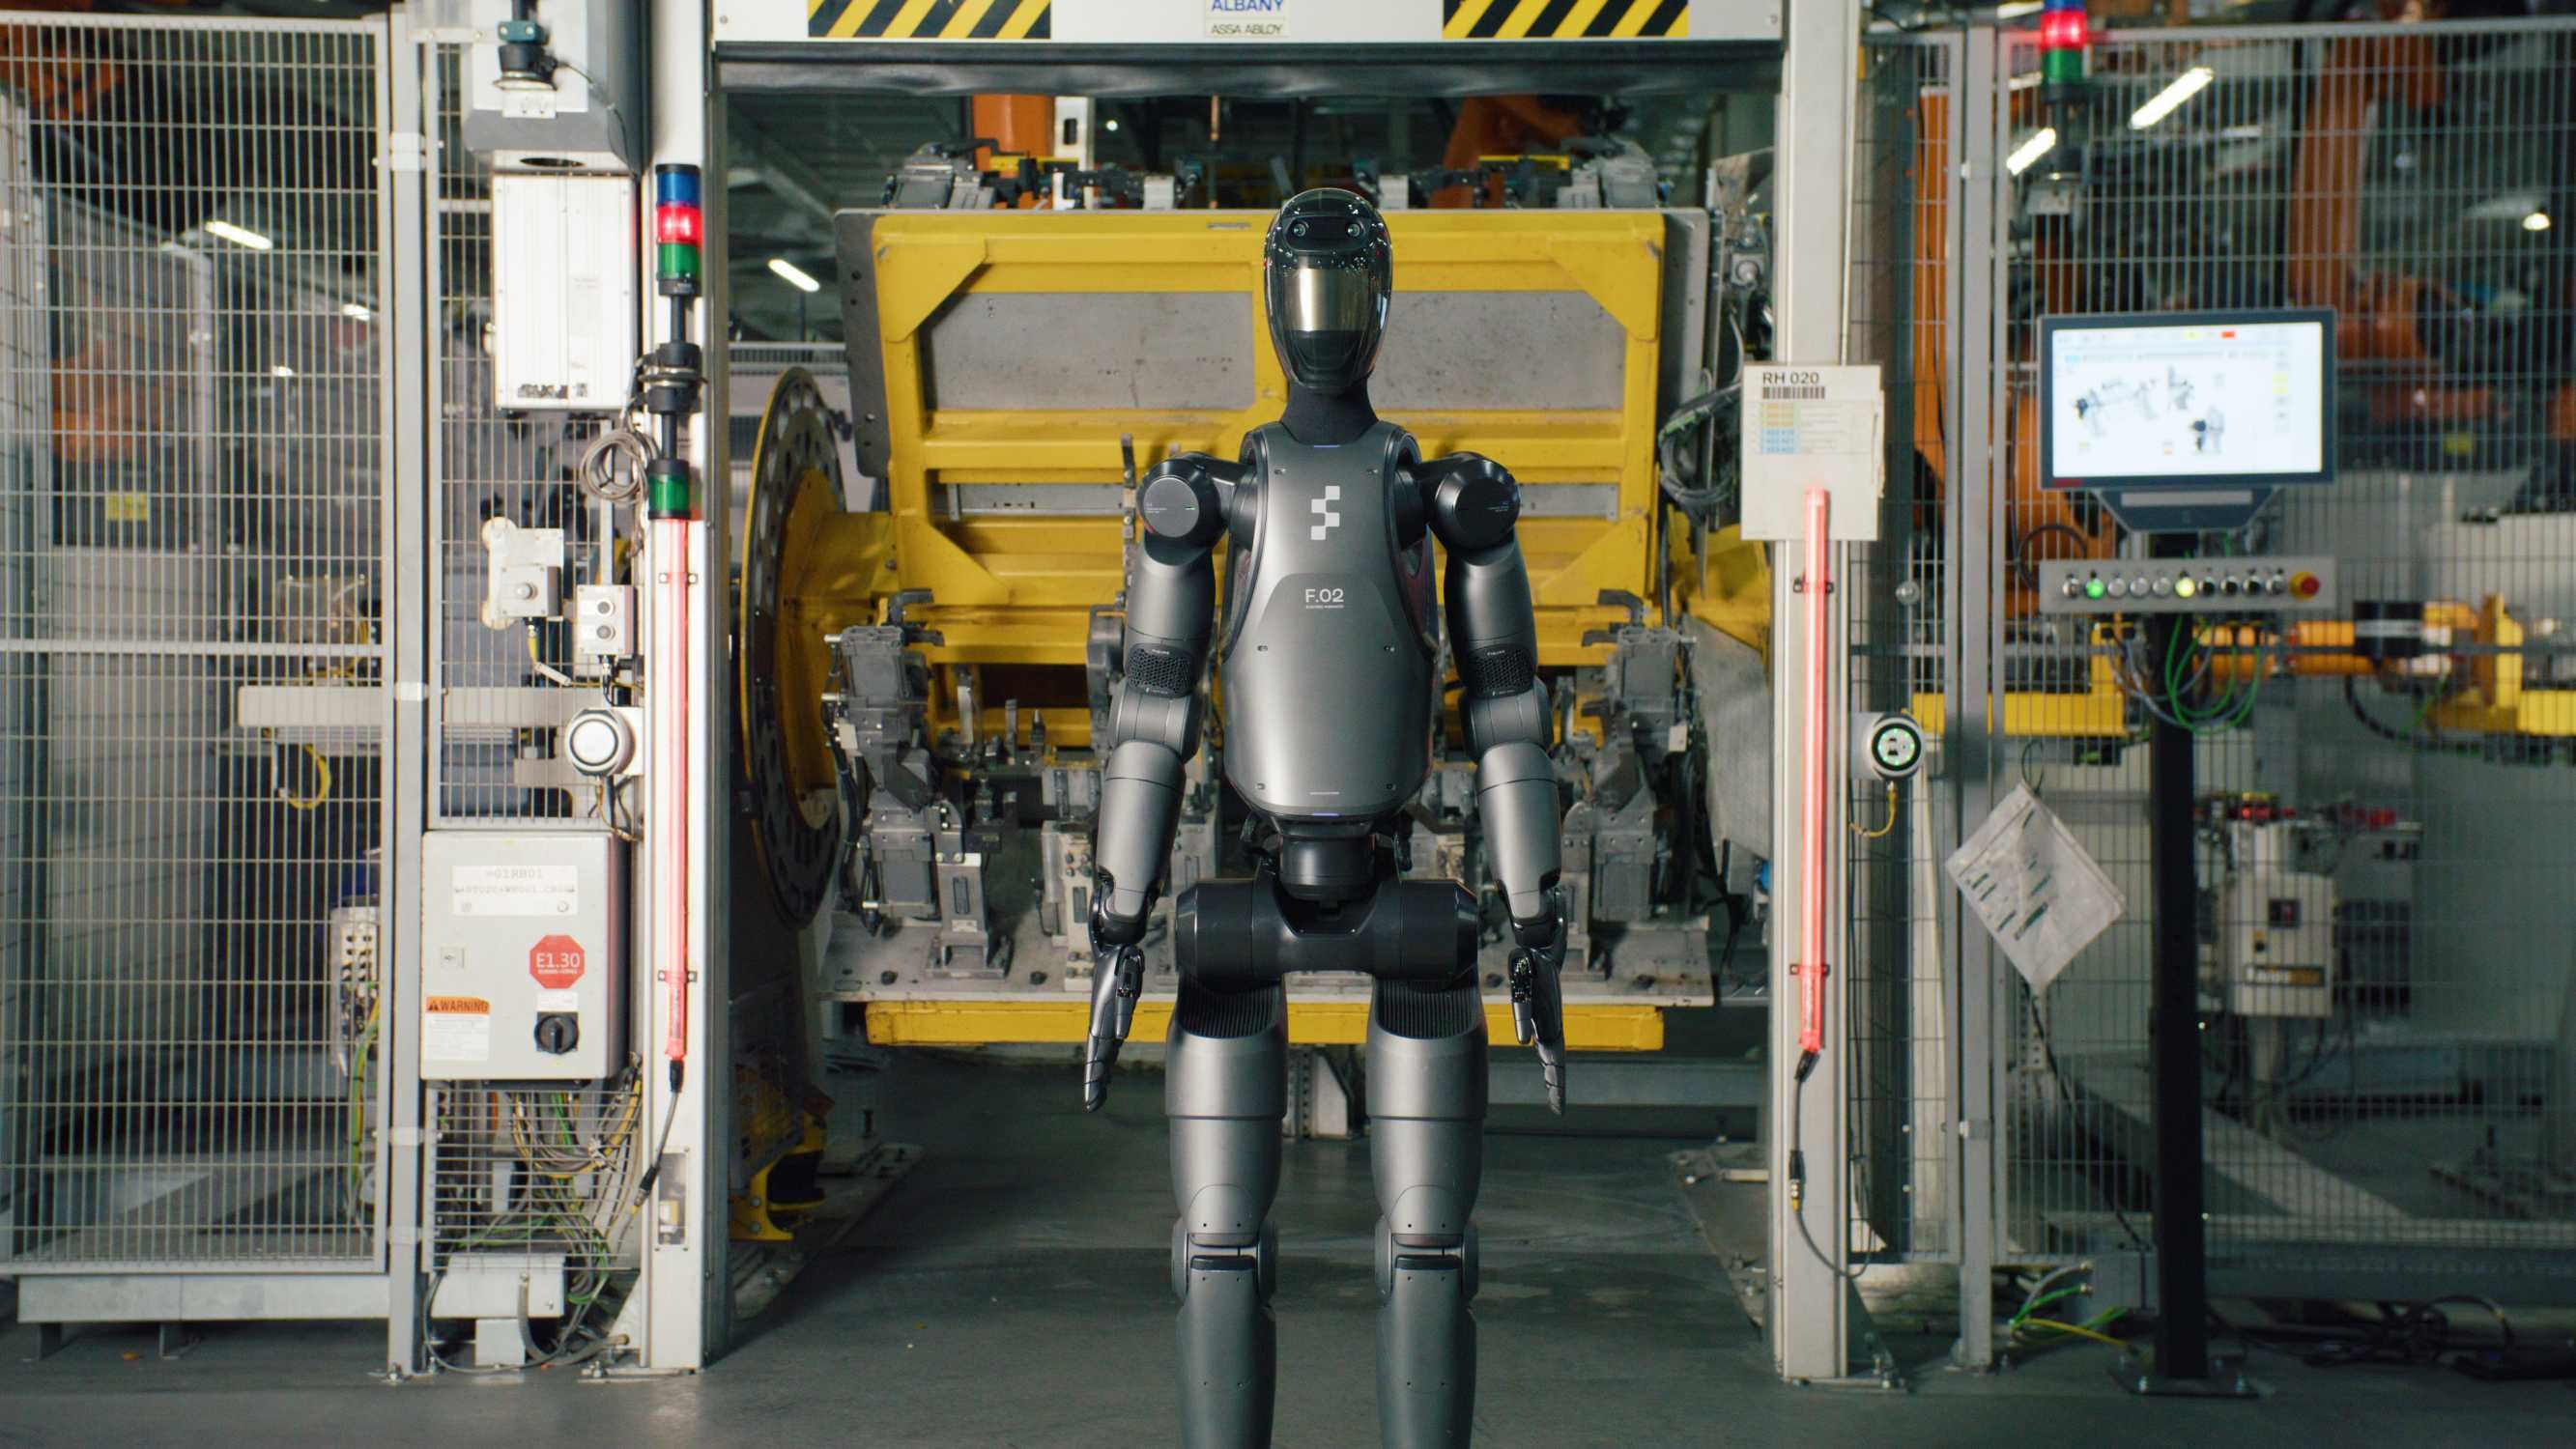
The figure(s) that Brett was able to pull off were really impressive
Sector-Specific Patterns
Logistics and warehouse automation: 2-5x revenue multiples with faster paths to revenue. Agility Robotics raised $400M at $1.75B. Collaborative Robotics closed $100M Series B at $500M post-money.
Humanoid robots and AI software: 20-50x+ multiples. Foundation models for robotics command AI-level valuations rather than hardware multiples. Skild AI raised $300M Series A at $1.5B valuation.
Defense and critical infrastructure: 3-8x multiples. Gecko Robotics at $1.25B. High margins from government contracts but CFIUS complexity limits investor base.
Strategic investors (Amazon, NVIDIA, OpenAI, Microsoft) pay 20-40% premiums for strategic fit. Figure AI’s cap table includes all these players, validating their $2.6B Series B and enabling the 15x jump to $39.5B within 18 months.
Deep Tech Versus SaaS Cap Tables
The differences aren’t subtle variations. They’re structural differences that change everything.
SaaS companies achieve 70-90% gross margins with near-zero marginal costs. Robotics companies hit 30-60% gross margins. Every robot requires physical components, assembly labor, shipping costs, warranty service.
Current humanoid robot unit costs sit around $250,000 per unit. Targets are below $50,000 for mass adoption, requiring massive scale (10,000+ units) to reach profitability.
Time to revenue stretches 2-4 years for robotics versus 6-18 months for SaaS. This forces more funding rounds. Expect 5-8 rounds from founding through exit versus 3-4 for software. More rounds mean more dilution.
Option pools run larger in deep tech. SaaS companies maintain 10-20% pools. Deep tech often requires 30-40% to attract robotics engineers, computer vision specialists, and manufacturing experts who command premium compensation.
Non-Dilutive Funding: The Hidden Leverage
SBIR/STTR programs represent “America’s Seed Fund” with $4B+ annually across 11 federal agencies. Companies can receive $1-3M+ across phases with zero equity dilution.
The three phases:
Phase I: Feasibility, $50K-$250K, 6-12 months
Phase II: Development, $500K-$2M, 24 months
Phase III: Commercialization, variable amounts
NSF SBIR/STTR funds ~400 companies per year with awards from $400K to $2M+. DoD offers higher Phase II awards up to $3-5M with direct paths to programs of record. NASA funds space robotics with Phase III contracts exceeding $1M.
The cap table impact: Raising $1M in SBIR/STTR instead of equity preserves 10-15% of founder ownership through Series A. A typical strategy: raise $1M SAFE at seed instead of $2M by securing $1M SBIR funding. This reduces dilution from 20% to 10% at seed. That 10 percentage point difference compounds through later rounds.
Pittsburgh’s robotics companies received $427M in SBIR/STTR funding. Companies like Neya Systems ($10M+), Carnegie Robotics, and RE2 Robotics built sustainable businesses on government contracts before raising significant venture capital.
The catch: NSF SBIR/STTR explicitly excludes companies majority-owned by VC firms. You must apply before or immediately after your first institutional round.
Strategic sequence: Apply for Phase I before any venture raise. Use Phase I to de-risk technology. Raise seed with Phase II application pending. Use Phase II award to bridge seed to Series A, dramatically reducing equity capital needed.
Common SAFE Mistakes
Setting Caps Too Low
If an investor proposes $8M and you accept it, but could have negotiated to $10M, you’ve given away an extra 2.5% permanently. At a $200M exit, that costs you $5M. Always counter initial offers 30-50% higher with comparable company data.
Multiple SAFE Rounds at Increasing Caps
Rolling closes at $6M, $8M, $10M, and $12M caps feel like momentum. You’re creating complexity that Series A investors hate. Each cap requires separate conversion calculations. Total SAFE exposure above $3M at multiple caps becomes problematic.
Failing to Model Dilution
Founders raise three SAFEs thinking “5-10% each.” When Series A prices at $35M pre-money, all SAFEs convert below Series A pricing, and suddenly founders discover 45%+ total dilution when they expected 30%. Use cap table software to model SAFE conversion at realistic Series A valuations immediately after every SAFE closes.
Investor View: How They Model Your Cap Table
VCs model your company backward from exit value.
If they see founders dropping below 10% ownership by Series B, they start planning for replacement.Their math assumes that alignment and motivation decline sharply once you fall into single-digit ownership.
Keeping your stake above 15% isn’t ego… it’s survival.
Red Flags to Walk Away From
Liquidation preferences above 1x in SAFEs or seed rounds mean the investor expects failure. If an investor requests 2x or 3x participating preferred at seed stage, they’re structuring for acquisition below their investment where they get multiples while founders get nothing. Walk away or negotiate back to 1x non-participating.
Board seats granted in SAFE investments bypass proper governance sequencing. A SAFE investor writing $500K shouldn’t get a board seat when Series A investors writing $10M get board seats. Offer board observer rights, but defer board seats to Series A.
Advisory shares for investors on top of their investment is double-dipping. If someone invests $250K and wants 0.5% advisory shares for “helping with strategy,” they’re getting equity twice. Treat them like any other advisor with standard grants (0.25%) with two-year vesting.
Veto rights on corporate actions give SAFE investors outsized control. A SAFE holder with 5% ownership shouldn’t block your Series A because they don’t like terms. Reject any veto rights before Series A.
Transferable pro rata rights let investors sell or auction their allocation rights to third parties. Always include “pro rata rights are non-assignable and non-transferable without company consent.”
FAST Action Steps
At Founding:
Implement four-year vesting with one-year cliff for all founders
File 83(b) elections within 30 days (mandatory and time-sensitive)
Reserve 10-15% for future option pool
At First Outside Capital:
Transition to Pulley free plan (up to 25 stakeholders)
Use Y Combinator post-money SAFE templates only
Set cap 30% higher than initial investor offer ($6-10M for robotics pre-seed)
Model SAFE conversion at realistic Series A valuations before closing
Apply for SBIR/STTR Phase I grants in parallel
Six Months Before Series A:
Consolidate multiple SAFEs into single terms if possible
Get fresh 409A valuation (mandatory for due diligence)
Prepare 18-24 month hiring plan to justify option pool size
Model Series A scenarios at $30M, $40M, $50M pre-money
During Series A Negotiations:
Negotiate option pool size with hiring plan data
Limit pro rata rights for seed investors (may need 50% participation cap)
Ensure 1x non-participating liquidation preference only
Model exit scenarios to understand when founders make money
Ongoing Maintenance:
Update cap table within 7 days of every transaction
Review fully diluted ownership monthly
Model fundraising scenarios quarterly
Maintain 409A valuations (update every 12 months minimum)
Plan next fundraising round 9-12 months before cash-out date
Every percentage point of equity you preserve at seed is worth 3-4x that by Series B and potentially millions at exit. Your cap table tells the story of your company. Make it a story where founders, employees, and investors all win together.
FYIAS (For Your Impatient Attention Span)… glad to see you here ;)
Anyways, I know how it is, and here you go:
Robotics founders face 5-8 funding rounds versus 3-4 for software, burning $500K-2M monthly versus $100K-500K. By Series B, you’ll own less than 10% compared to 15-25% for software founders.
Post-money SAFEs at $10M caps are standard for robotics seed rounds. Multiple SAFE rounds at escalating caps create “high resolution financing” that Series A investors hate. SBIR/STTR grants provide $1-3M+ with zero dilution.
Every percentage point preserved at seed is worth 3-4x that by Series B.
Master the conversion mechanics or watch your ownership evaporate.